Highlights
- Quarter in review
- Outlook
- Asset class returns
- Portfolio changes
Quarter in review
During the period, the quarter delivered the classic “higher yields + solid growth + commodity strength” mix, with oil the dominant winner and bond duration the clear loser.
US 2y and 10y yields led global yields higher producing the clearest underperformance in fixed income.
This is consistent with a solid global growth backdrop (especially US data) that reduced the case for lower policy rates and pushed term yields higher. A further sharp rise in oil and energy prices due to the ongoing turmoil in the Middle East and Ukraine-Russia had further aggravated the case for Fixed income. One of the only bright lights in the Fixed Income market was the Brazil 10y that delivered a positive 5% (in ZAR and LC) as the market continued to take advantage of the significant real yields that Brazil bonds trade on.
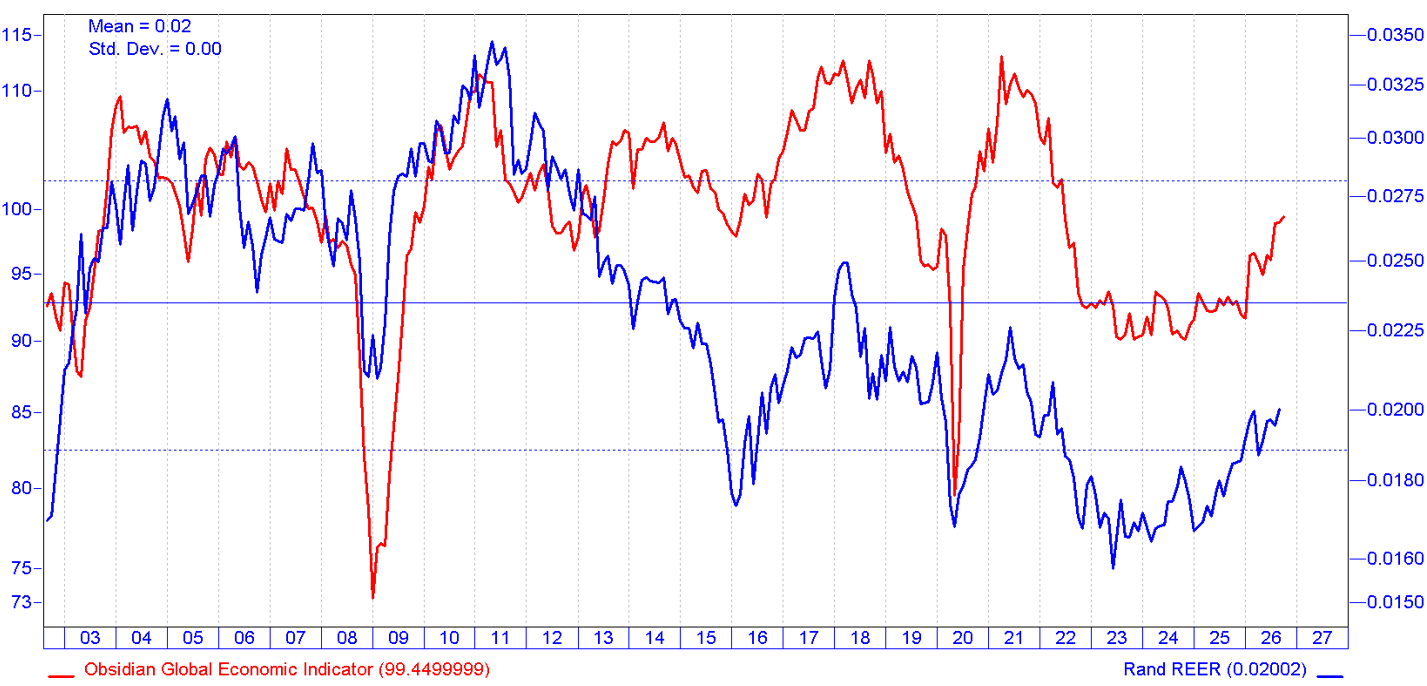
The USD finished only marginally stronger despite the significant rise in US yields through the quarter. Most major crosses against the rand were flat to slightly negative. The strong global backdrop continues to support the Rand vs the USD. Historically, accelerating global growth has been supportive of Rand appreciation, especially in Real terms – the current environment supports this trend as per Chart 1 below.
Chart 1: Synchronised Global growth supports ZAR appreciation vs the USD
Source: IRESS (12 October 2026)
Growth-sensitive and commodity assets led with continued buoyancy in commodity markets and Global equities outperforming as fixed income sold off reflecting the solid US-led growth narrative.
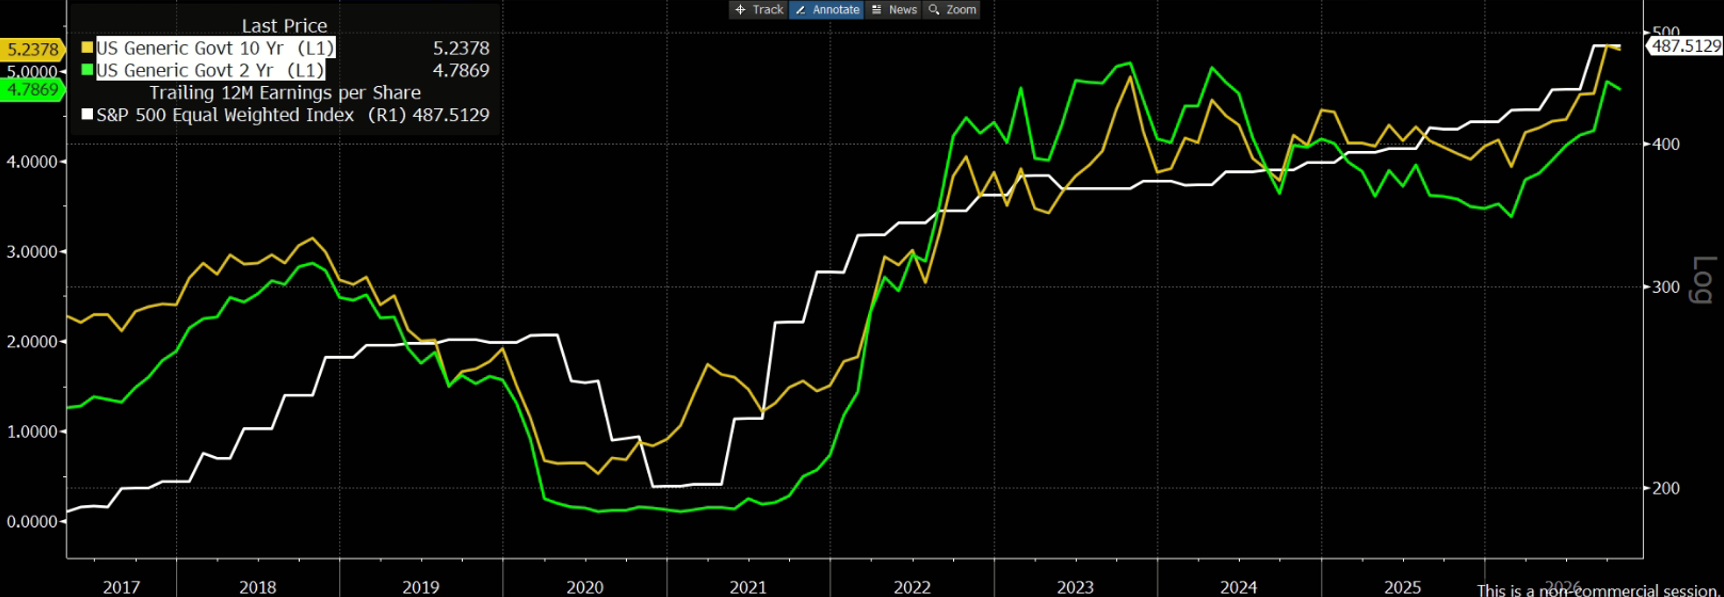
Very strong profit growth off the back of a very buoyant economy have buttressed global equity from the rise we have seen in global interest rates, this trend is illustrated in Chart 2 below.
Chart 2: Accelerating US Earnings growth offsetting rising interest rates
Source: BLOOMBERG (12 October 2026)
The rise in global yields through the quarter put pressure on traditional Interest rate sensitive assets; MSCI World and SA Real Estate, smaller-cap and the rate-sensitive US equity, SA Interest rate sensitive equity and SA Banks all suffered losses during the quarter.
The quarter saw inflation rates push higher with stronger global growth continuing to defy the increased uncertainty from the geopolitical turmoil in the Middle East and Russia-Ukraine War.
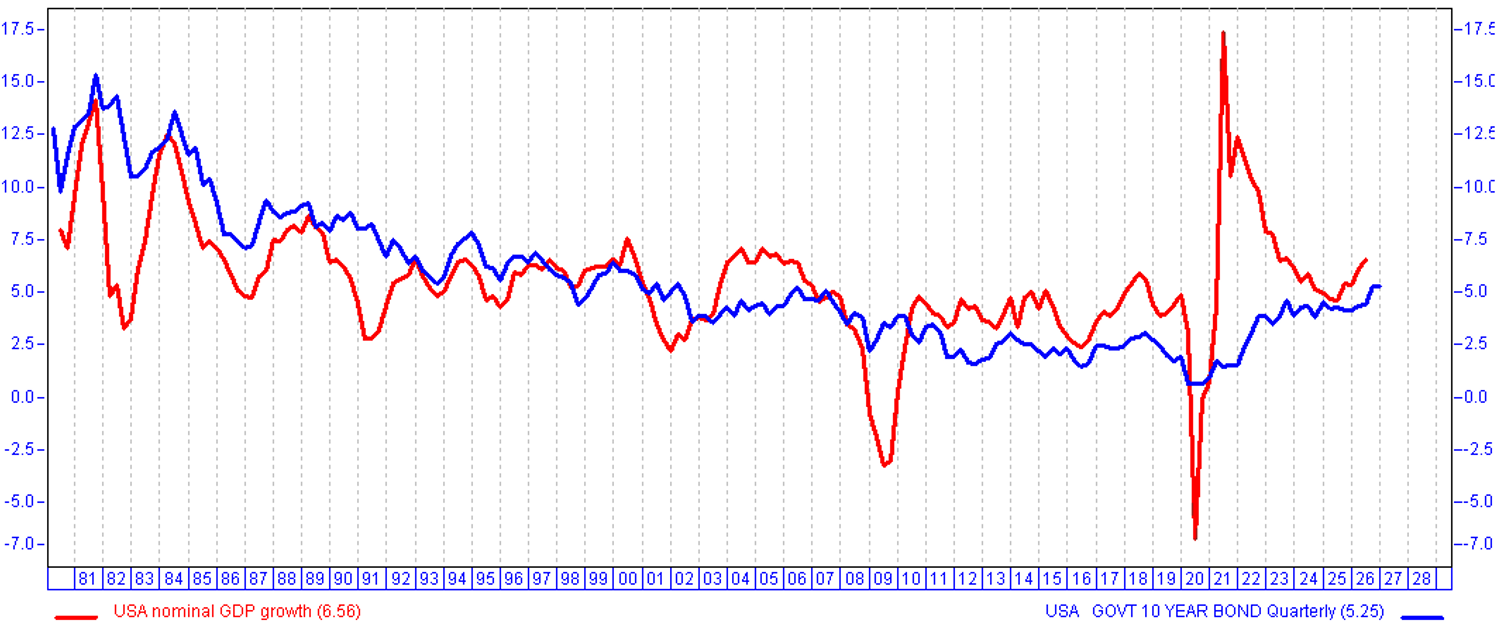
The steadily rising global bond market on the back of accelerating growth and inflation can be best illustrated in below chart below that shows US nominal growth and US 10y bonds. The acceleration in both growth and inflation through 2026 has been a toxic cocktail for Global Fixed Income.
Chart 3: Strong US growth and rising inflation lead US yields higher
Source: IRESS (12 October 2026)
Outlook
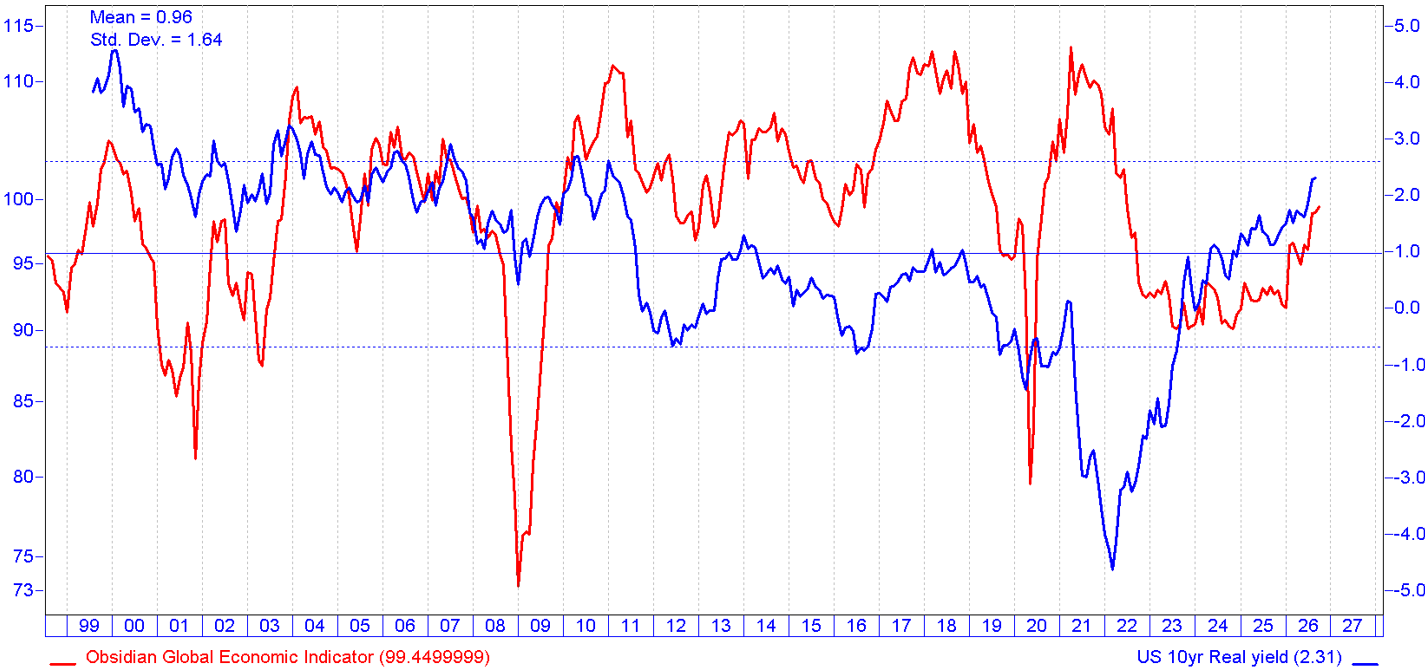
After an aggressive rise in the entire US yield curve through the quarter, we are hopeful that further rises will be tempered going forward. Significant real yields particularly in long duration bonds should start to be noticed by the market, particularly as they are now back to levels prior to the “financial repressive” Post-GFC period. Saying that, we believe that US bond yields are unlikely to rally materially until US and Global growth momentum eases. Chart 4 below highlights the tight relationship between the direction of global growth and real US 10y yields.
Chart 4: Global growth momentum needs to roll over before US yields rally
Source: IRESS (12 October 2026)
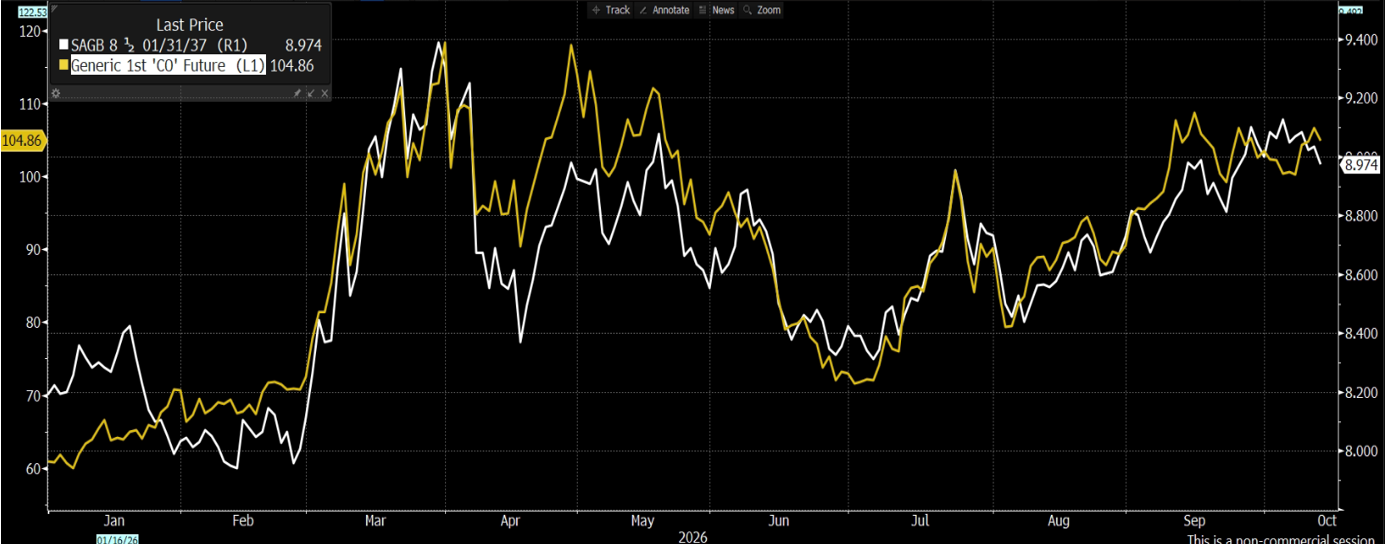
At the same time as global growth accelerates, rising global and local inflation has been further aggravated by rising energy costs. It is critical that energy prices roll over before we see a sustained rally in domestic and global bond yields (Chart 5).
The unpredictable nature of the war in both the Middle East and Ukraine coupled with a looming drought on the back of a very significant El Nino event will make inflation forecasting in the months ahead more challenging that usual. Encouragingly, core inflation domestically and offshore remain reasonably anchored for now with little evidence yet of second round effects from higher energy prices.
Chart 5: Energy prices remain critical for determining direction of Bond yields
Source: Bloomberg (12 October 2026)
Synchronised global growth and a supportive commodity cycle should hopefully continue to support the Rand vs the USD going forward. Domestic and select EM equities remain attractively valued both on an absolute and relative to Developed Markets. EM fixed Income particularly Brazil, Mexico and South Africa continue to offer attractive real yields.
Asset Class Returns
Key Market Takeaways for the Quarter ended
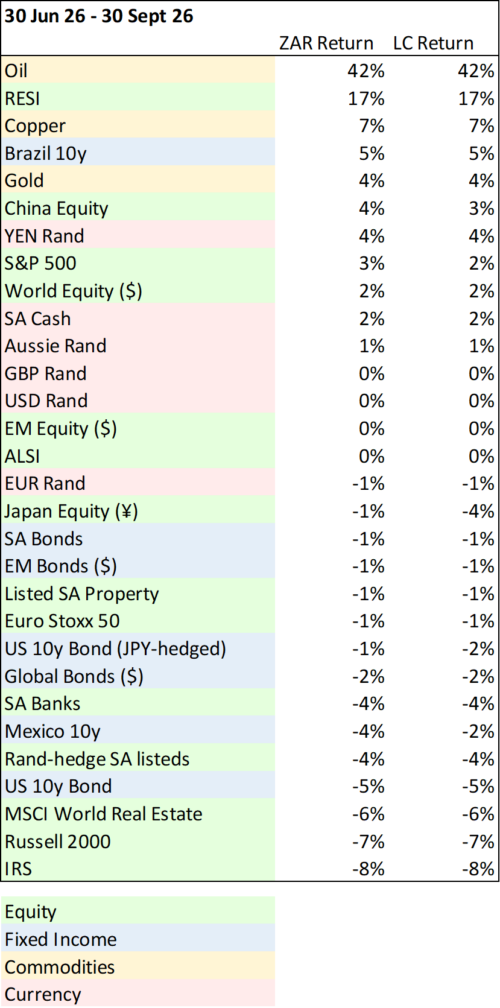
- The Rand was broadly stable against the majors with little currency translation effect which marked change from the broad strength of the prior quarter. USD/ZAR and GBP/ZAR were flat, EUR/ZAR was down 1% and AUD/ZAR up 1%. The yen was the exception, with JPY/ZAR up 4%.
- Developed and emerging market equities were muted after Q2’s strong rally. In LC terms the S&P 500 returned +2% (+3% ZAR), World Equity +2%, EM Equity flat and the Euro Stoxx 50 –1%. Small caps gave back a large portion of their Q2 gains, with the Russell 2000 down 7%. Japan, last quarter’s standout, fell 4% in yen, though yen strength cushioned the return to –1% in ZAR. China Equity, the Q2 laggard, was the best-performing major equity market at +4% in ZAR.
- Bond markets were largely negative. US 10-year Treasuries were the weakest, down 5%, while Global Bonds (–2%), EM Bonds (–1%) and SA Bonds (–1%) were all modestly lower. Mexico 10-year fell 4% in ZAR (–2% LC) and the JPY-hedged US 10-year was down 1% in ZAR. Brazil 10-year was the clear exception, returning +5%.
- Domestic equities were flat at the index level but again masked a sharp internal rotation. RESI led strongly at +17%, while the Interest Rate Sensitive (IRS) basket that led in Q2 fell 8% with SA Banks down 4% and Listed SA Property down 1%. This is a direct reversal of the prior quarter, when property, banks and IRS counters led and resources lagged.
- Commodities were the story of the quarter, this time to the upside. Oil surged 42%, resurging from Q2’s 40% decline. Copper added a further 7% and gold rose 4%, after its 17% fall last quarter. This broad-based commodity strength drove RESI’s +17% return.
In summary, the quarter largely reversed Q2’s dynamics. Commodities and resources, the biggest drag last quarter, became the biggest contributors, led by a 42% rebound in oil. In their place, rate-sensitive assets fell, with US Treasuries, small caps, global property and SA interest-rate-sensitive counters all lower. Global equities were muted, and a broadly stable Rand meant ZAR returns closely tracked local-currency returns. Domestically, the JSE was flat at the index level, masking a rotation firmly back in favour of resources over banks, property and other rate-sensitive counters.
Chart 6: Global Asset Q3 returns
LC Return = the security’s return expressed in its local currency.
ZAR Return = the security’s return expressed in South African Rand (ZAR).
Source: BLOOMBERG (30th September 2026)
Portfolio Changes
From an asset allocation perspective, we still prefer equities to bonds, and emerging markets over developed markets. Within equities, we favour South Africa and emerging markets, but also retain some select DM exposure in Japan, South Korea, US Tech, and Energy.
Our bond exposure is largely in emerging markets that are better priced than South Africa, such as Brazil and Mexico, although we are not negative on South African Bonds in isolation. We also hold slightly more cash than usual in the appropriate funds.
Looking at the sector changes
- The sectors with the largest reductions in exposure were Banks, Retail, Technology and Asset Management
- The sectors with the largest additions in exposure were Resources including Energy, Consumer Staples, Food Production and Industrials
|
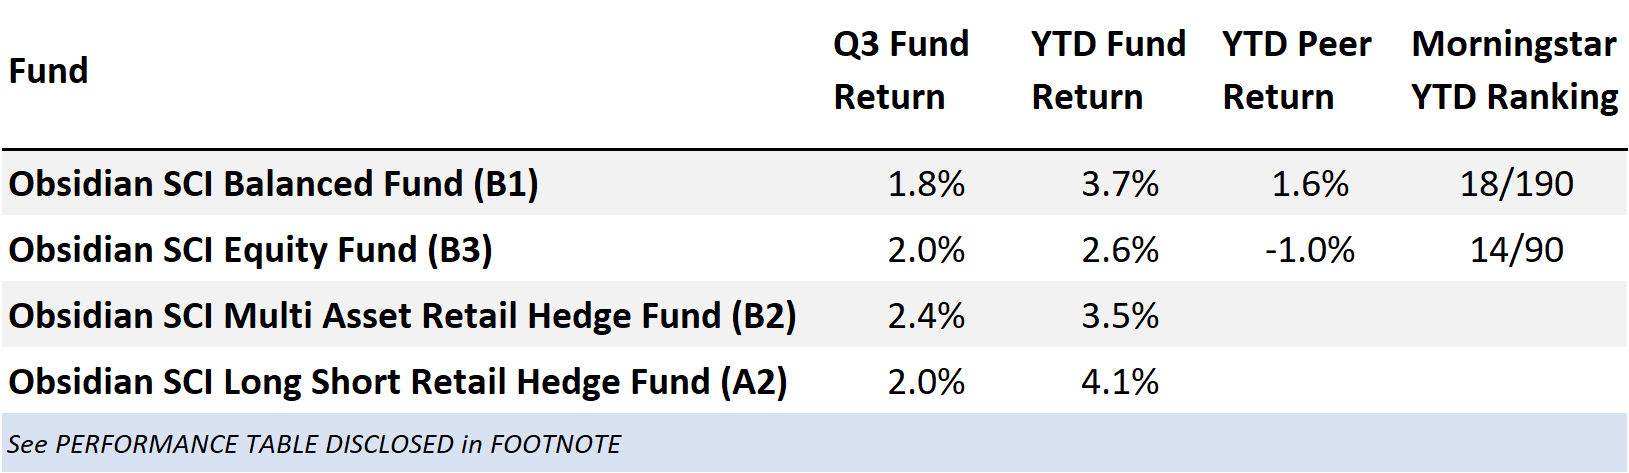
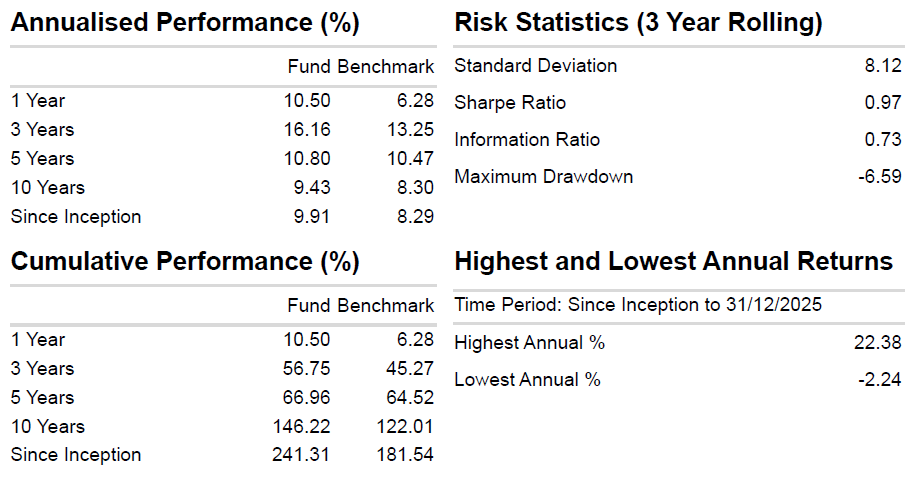
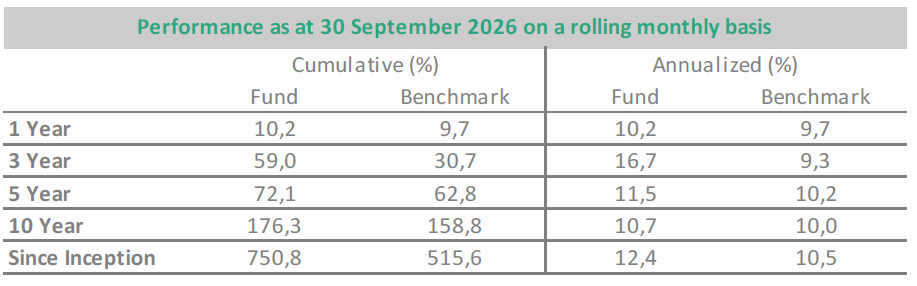
Obsidian SCI Balanced Fund (B1):
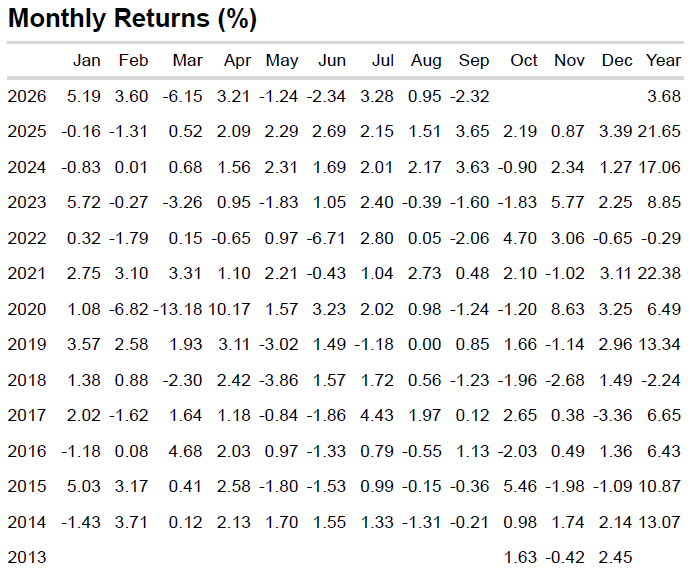
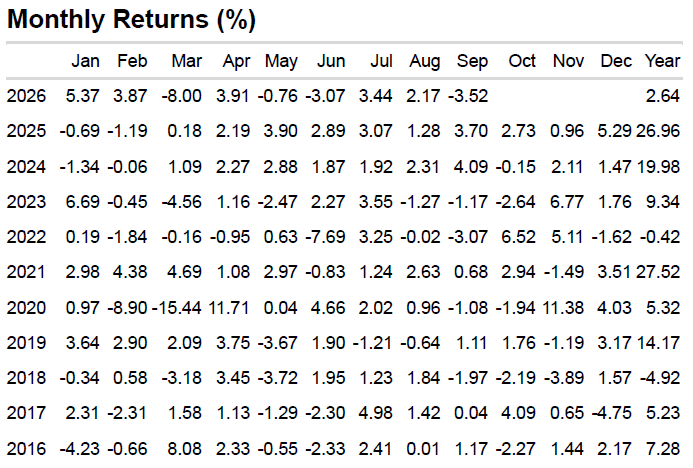
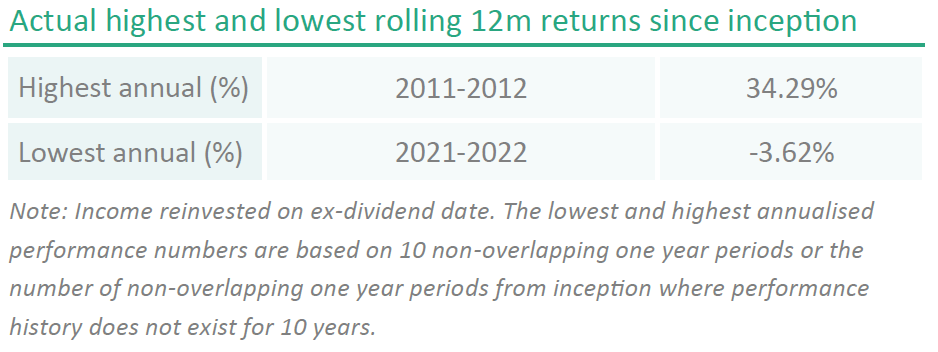
Obsidian SCI Equity Fund (B3)
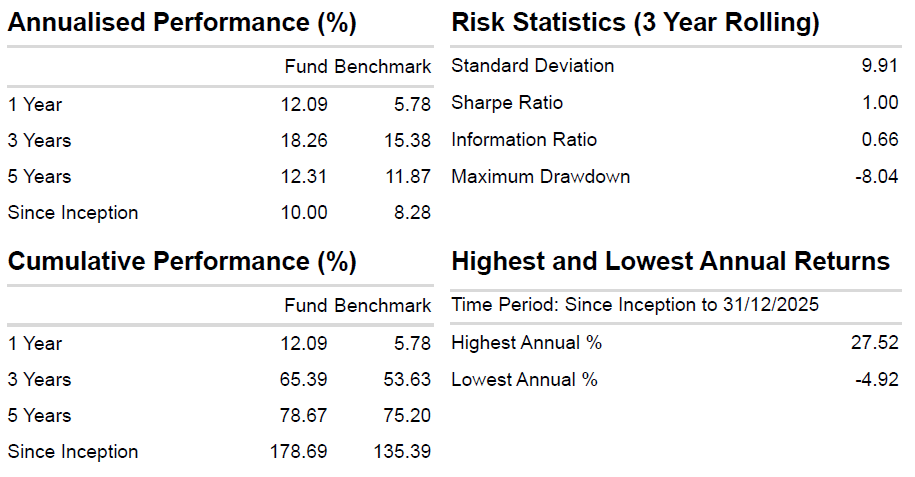
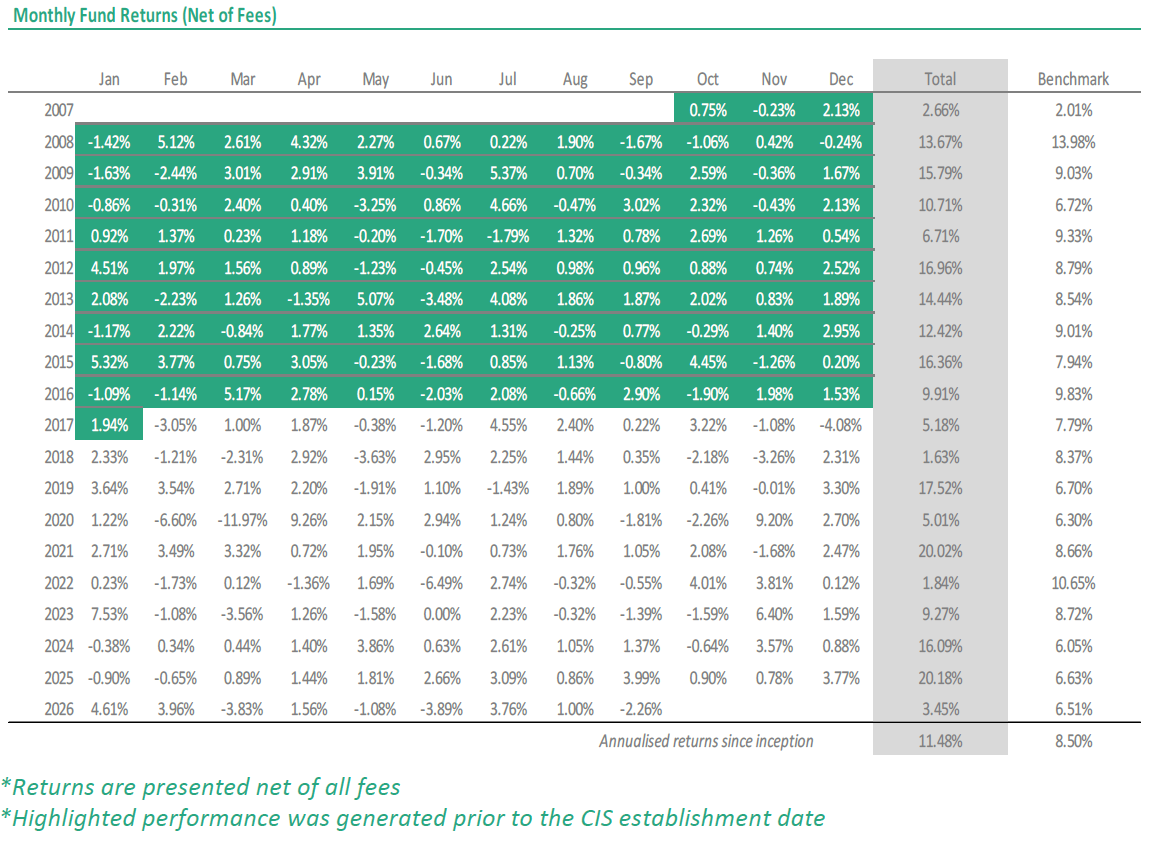
Obsidian SCI Long Short Retail Hedge Fund (A2)
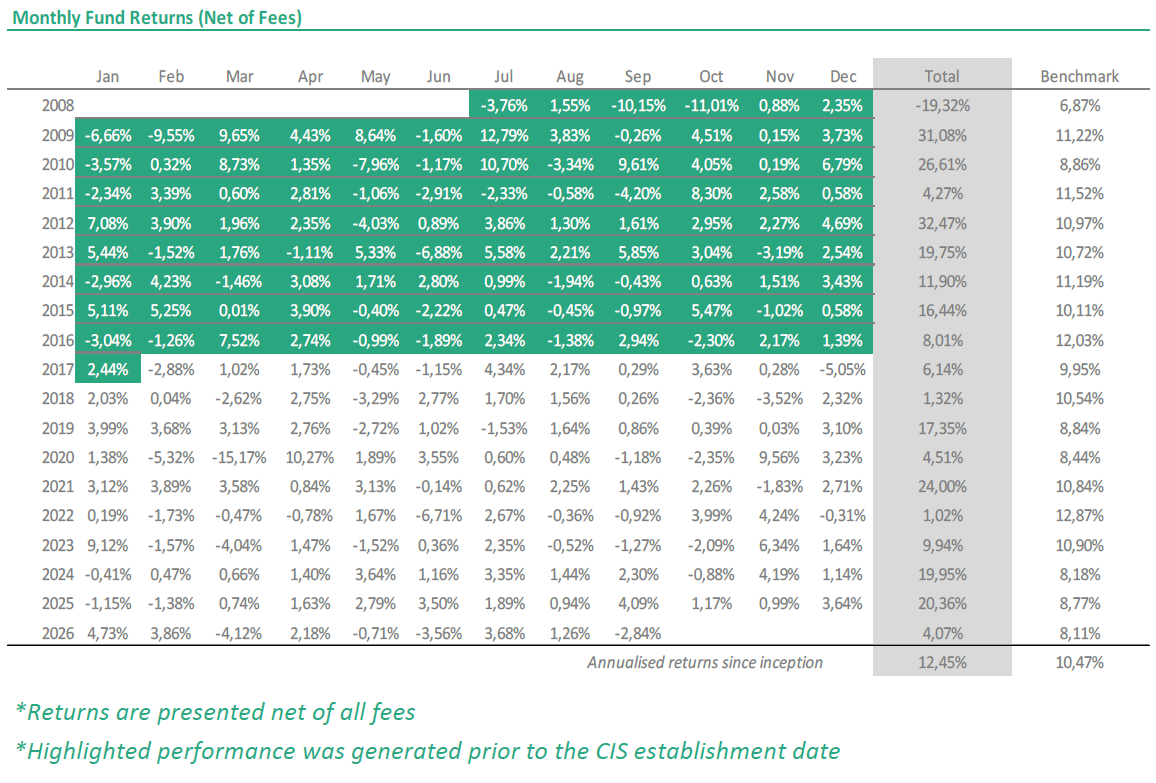
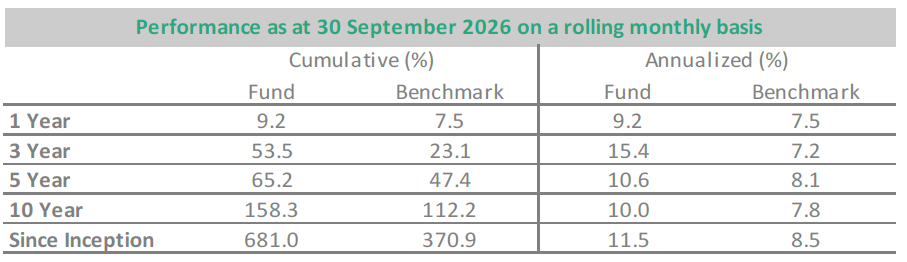
Obsidian SCI Multi Asset Retail Hedge Fund (B2)
Disclaimer: Obsidian Capital (Pty) Ltd (FSP number 32444) is an authorised Financial Services Provider in terms of the FAIS Act.
The information contained in this article does not constitute financial advice as contemplated in terms of the Financial Advisory and Intermediary Services Act, and should be read in conjunction with a minimum disclosure document (MDD) and the Upfront Disclosure Document. Use of or reliance on this information is at own risk. Independent professional financial advice should be sought before making an investment decision.
Sanlam Collective Investments (RF) (Pty) Ltd, a registered and approved Manager in Collective Investment Schemes in Securities. Collective investment schemes are generally medium- to long-term investments. Past performance is not necessarily a guide to future performance, and that the value of investments / units / unit trusts may go down as well as up. A schedule of fees and charges and maximum commissions is available from the Manager on request. Collective investments are traded at ruling prices and can engage in borrowing and scrip lending. The Manager does not provide any guarantee either with respect to the capital or the return of a portfolio. Performance is based on NAV to NAV calculations with income reinvestments done on the ex-div date. Performance is calculated for the portfolio and the individual investor performance may differ as a result of initial fees, actual investment date, date of reinvestment and dividend withholding tax. The manager has the right to close the portfolio to new investors in order to manager it more efficiently in accordance with its mandate.
While CIS in hedge funds differ from CIS in securities (long-only portfolios) the two may appear similar, as both are structured in the same way and are subject to the same regulatory requirements. The ability of a portfolio to repurchase is dependent upon the liquidity of the securities and cash of the portfolio. A manager may, in exceptional circumstances, suspend repurchases for a period, subject to regulatory approval, to await liquidity and the manager must keep the investors informed about these circumstances. Further risks associated with hedge funds include: investment strategies may be inherently risky; leverage usually means higher volatility; short-selling can lead to significant losses; unlisted instruments might be valued incorrectly; fixed income instruments may be low-grade; exchange rates could turn against the fund; other complex investments might be misunderstood; the client may be caught in a liquidity squeeze; the prime broker or custodian may default; regulations could change; past performance might be theoretical; or the manager may be conflicted.
A copy of the Performance fee Frequently Asked Questions can be obtained from our website: www.sanlaminvestments.com. Annualised return is the weighted average compound growth rate over the period measured.