Highlights
- Quarter in review
- Outlook
- Asset class returns
- Portfolio changes
Quarter in review
There are many adjectives to describe this quarter: volatile, uncertain, frustrating… the list goes on. With the global economy being held hostage by Iran’s closure of the Strait of Hormuz and endless headlines of a ceasefire being close to agreed upon between the USA and Iran, navigating the market has been a tricky endeavour. Given the importance to all stakeholders of a waterway that accounts for 25% of the world’s maritime oil trade and roughly 20% of global LNG shipments, the view of ourselves and the market has ultimately been that the Strait of Hormuz would open one way or another and that the timing of such was the only uncertainty.
With the Islamabad Memorandum of Understanding officially signed by the two parties on 17 June 2026 it had initially validated this view and demonstrated that both sides could close a significant gap in demands. However, with the recent breakdown of the ceasefire with a resumption of hostilities, significant diplomatic ground must still be covered before a definitive agreement can be reached. The economic imperative to reopen the Strait of Hormuz will only become more acute though.
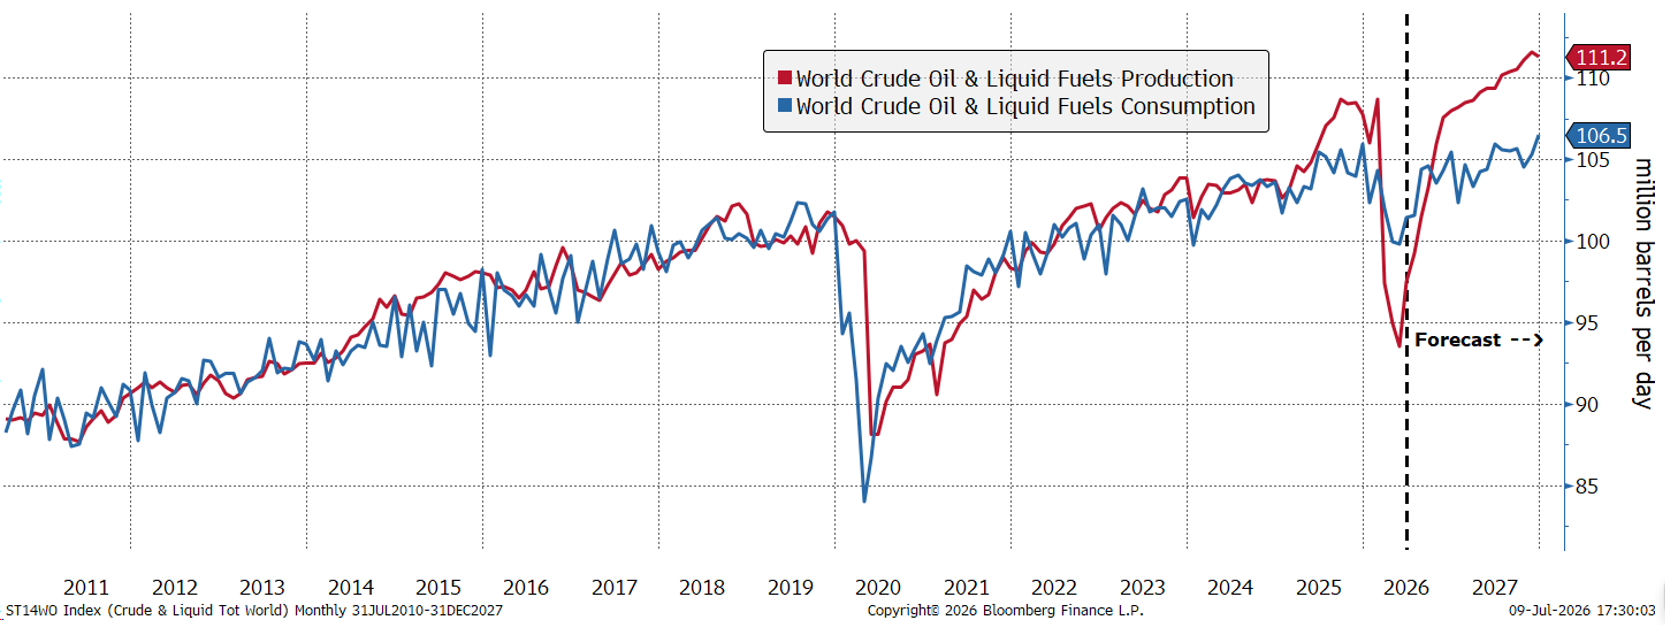
While oil production has certainly lagged consumption since the Strait of Hormuz closure, it appears a rapid drawdown of oil reserves has been sufficient to meet demand. With this drawdown largely considered to be a temporary measure given expectations of an eventual reopening of the Strait and a resumption of oil production, the oil price has been effectively managed lower throughout the crisis. Latest forecasts by the US Energy Information Administration have a global oil market that is oversupplied again by the end of the year:
Chart 1: EIA forecast of oil demand vs supply
Source: Bloomberg (9 July 2026)
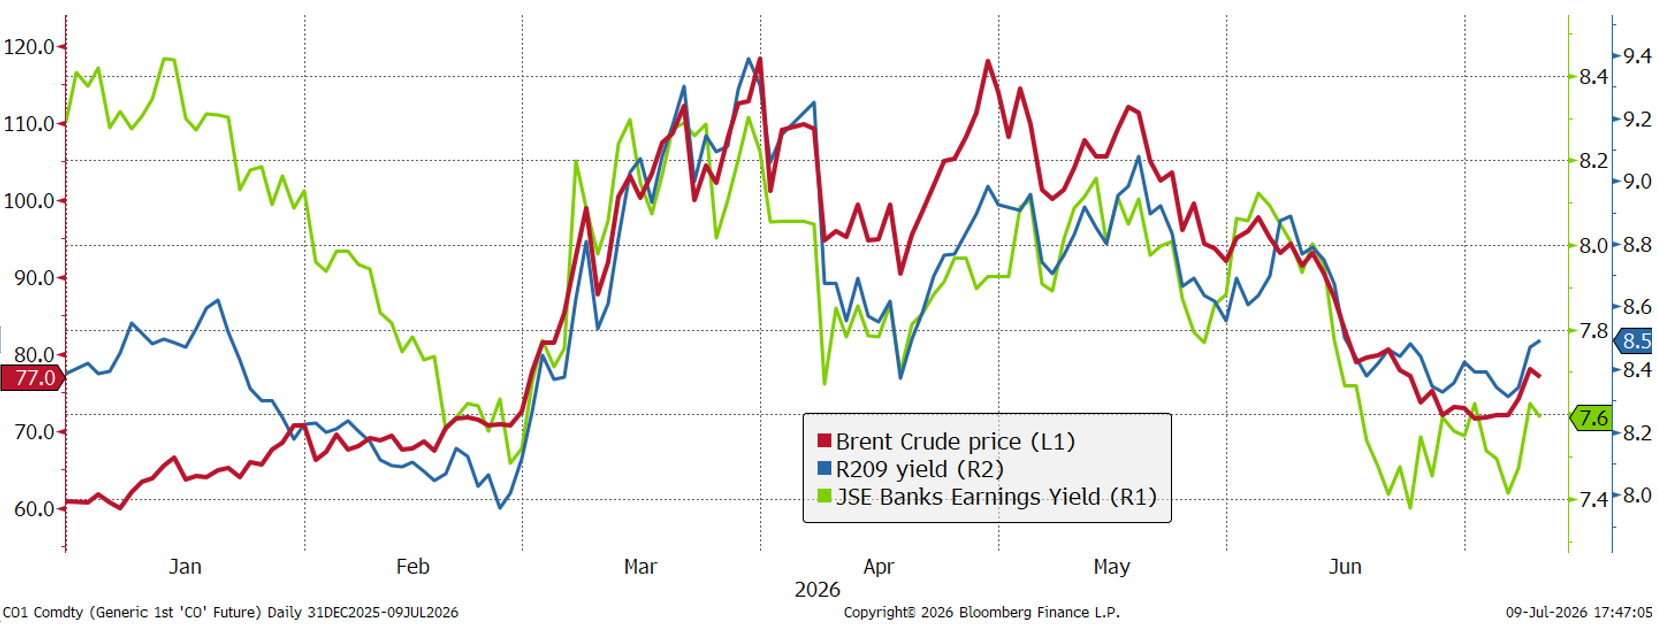
The correlation between the oil price, our 10-year government bond yield and the JSE Banking sector’s earnings yield has been extremely tight since the outbreak of the war on 28 February. It has been far from smooth sailing since maximum pain was felt at the end of March when Brent Crude hit a high of $120 but ultimately South African interest rate sensitive assets have largely recovered since then.
Chart 2: Interest rate sensitive yields vs Brent Crude
Source: Bloomberg (9 July 2026)
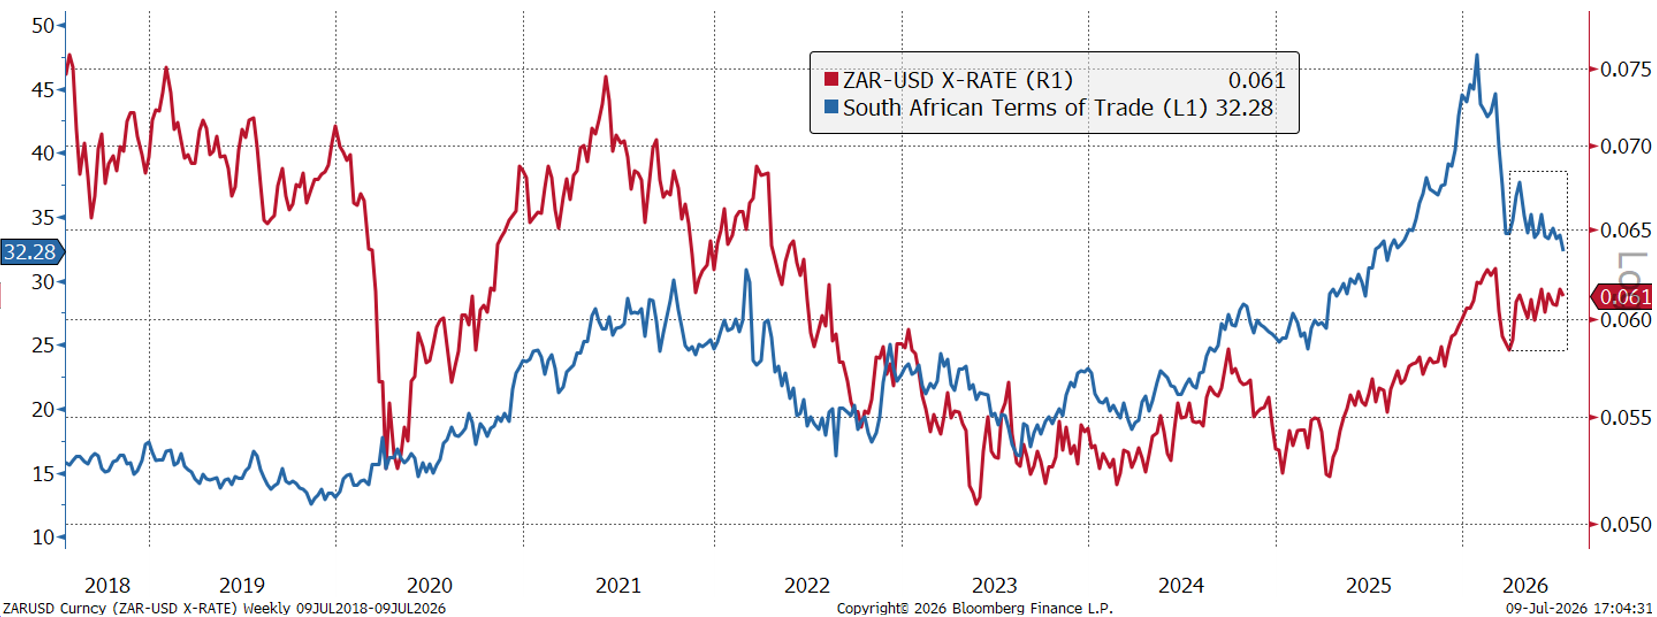
In addition, the rand has shown significant resilience despite pressure on our terms of trade as the prices of our all-important precious metal exports collapsed during the quarter (gold down 21% and platinum down 14%). Despite the year-to-date pullback in our terms of trade, South Africa’s trade balance remains at healthy levels and should still provide a lever of support for the rand.
Chart 3: Rand resilience vs still buoyant terms of trade
Source: Bloomberg (9 July 2026)
With precious metal miners comprising over 26% of the JSE All Share Index heading into Q2, the sharp sell-off in gold and PGM’s weighed heavily on the JSE Resources index (-20%). With other sectors like banks and retailers rallying from their lows the negative effect on the ALSI was largely offset.
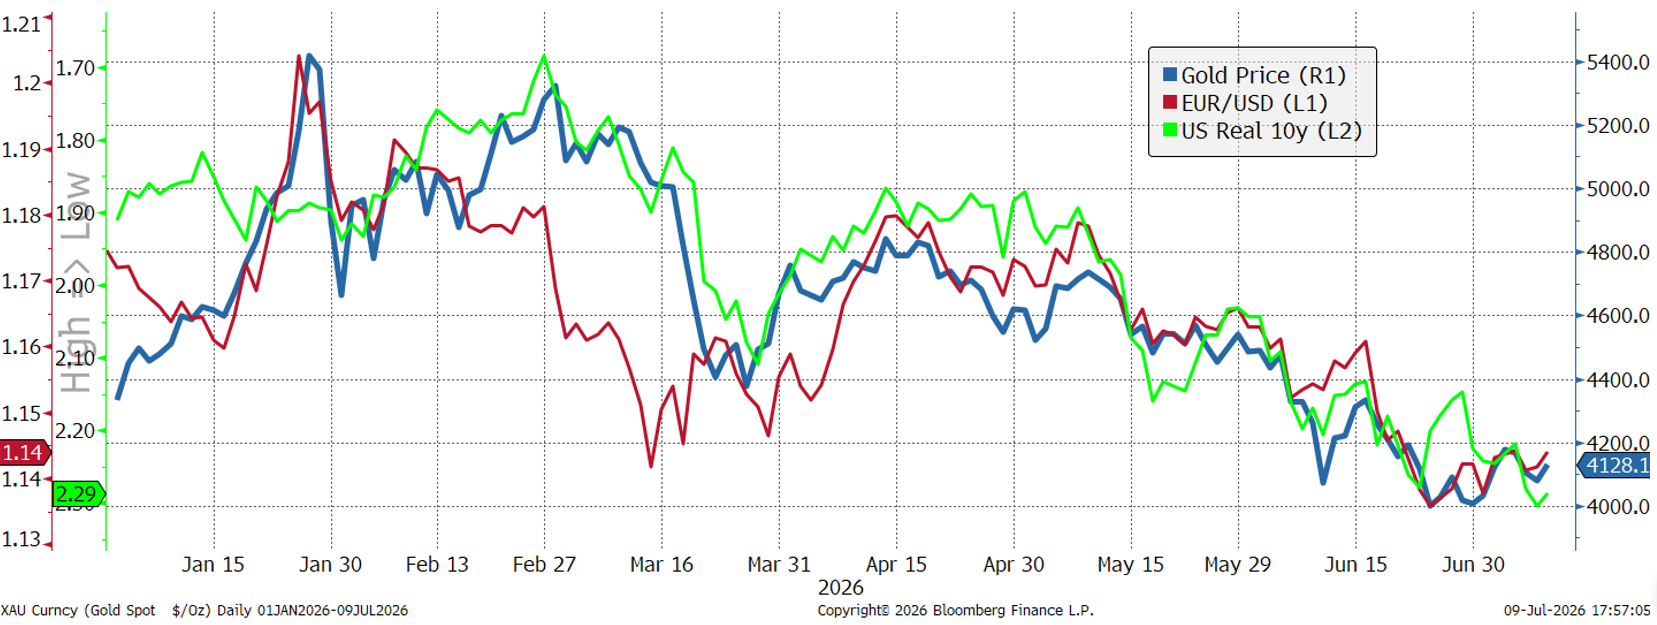
Following 3 blockbuster years for the yellow metal in which it returned 22% in 2023, 34% in 2024 and 43% in 2025, gold started exhibiting signs of retail-driven exuberance early on in the year with volatile moves. In fact, the gold price fell 9% in a single day following the CME raising margin requirements on gold futures in late January which triggered margin calls and subsequent deleveraging. Throughout the year though the gold price has been pressured by two sources which have traditionally driven the metal over time – a stronger US dollar and higher US real 10y yields (inverted below). While strong emerging market central bank buying has persisted since the Russia-Ukraine war, the swing factor this year has been a drying up of ETF inflows.
Chart 4: Gold price pressured by higher rates
Source: Bloomberg (9 July 2026)
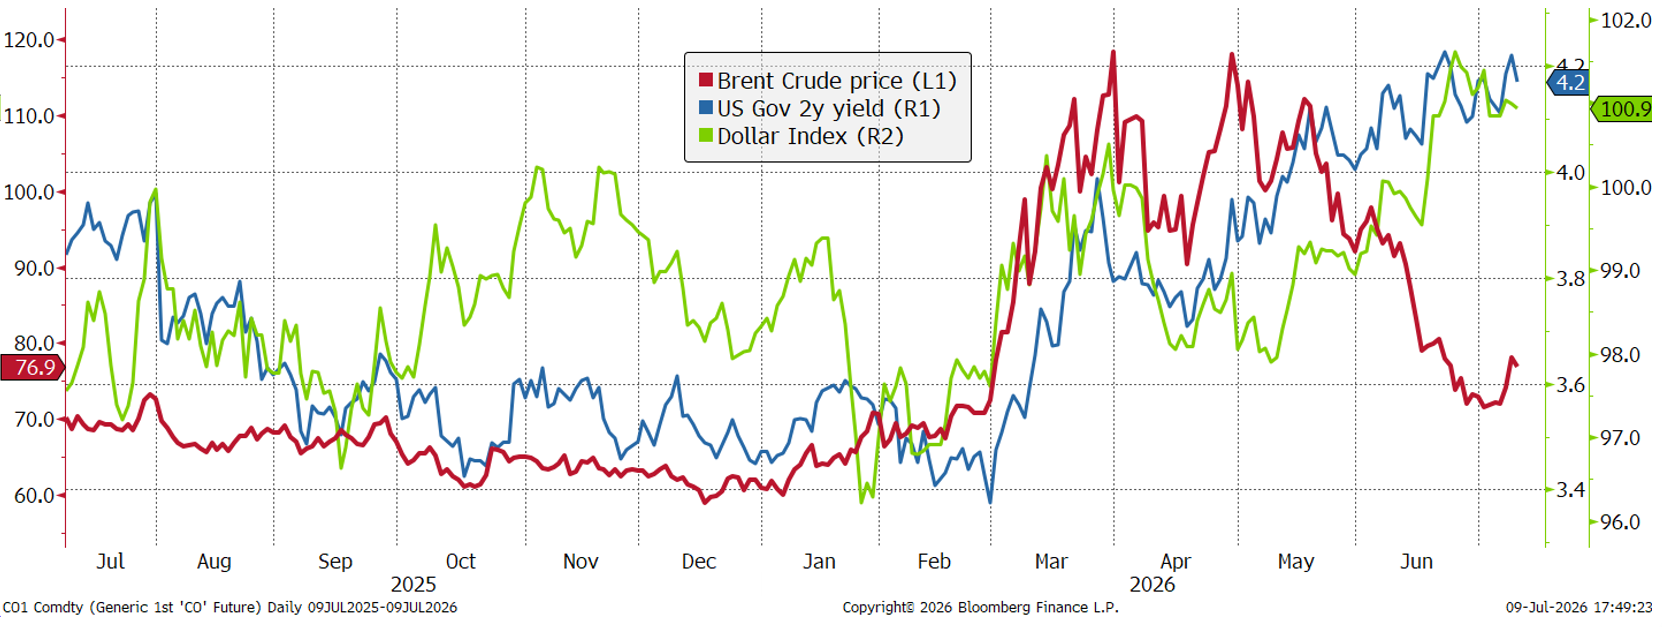
While it is logical that a rise in the oil price early on in the war drove bond yields higher, it is significant that since oil rolled over in mid-May bond yields in the US (and to a lesser extent Developed Market bond yields in general) have risen! As can be seen below, the higher carry in the US has boosted the dollar…
Chart 5: Breakdown between oil price and yields
Source: Bloomberg (9 July 2026)
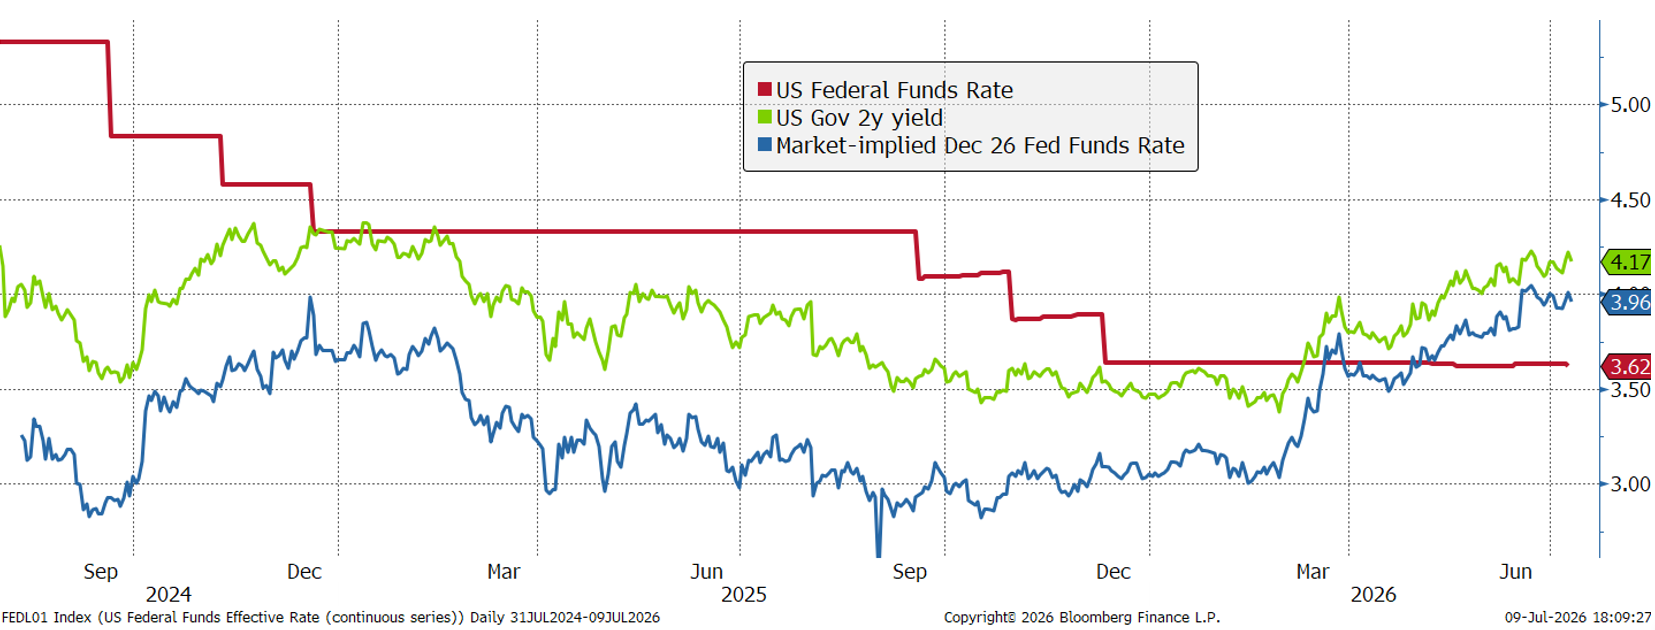
…and the market has gone from pricing in 2 rate cuts by the Federal Reserve this year to at least a rate hike! This is despite the oil price having fallen 35% from the peak at the time of writing.
Chart 6: A severe repricing in future Fed funds rates
Source: Bloomberg (9 July 2026)
We believe this has been due to a “quadruple-witching” which was aggravated by the new Fed Chair Kevin Warsh’s hawkish FOMC meeting. These can be summarised as follows:
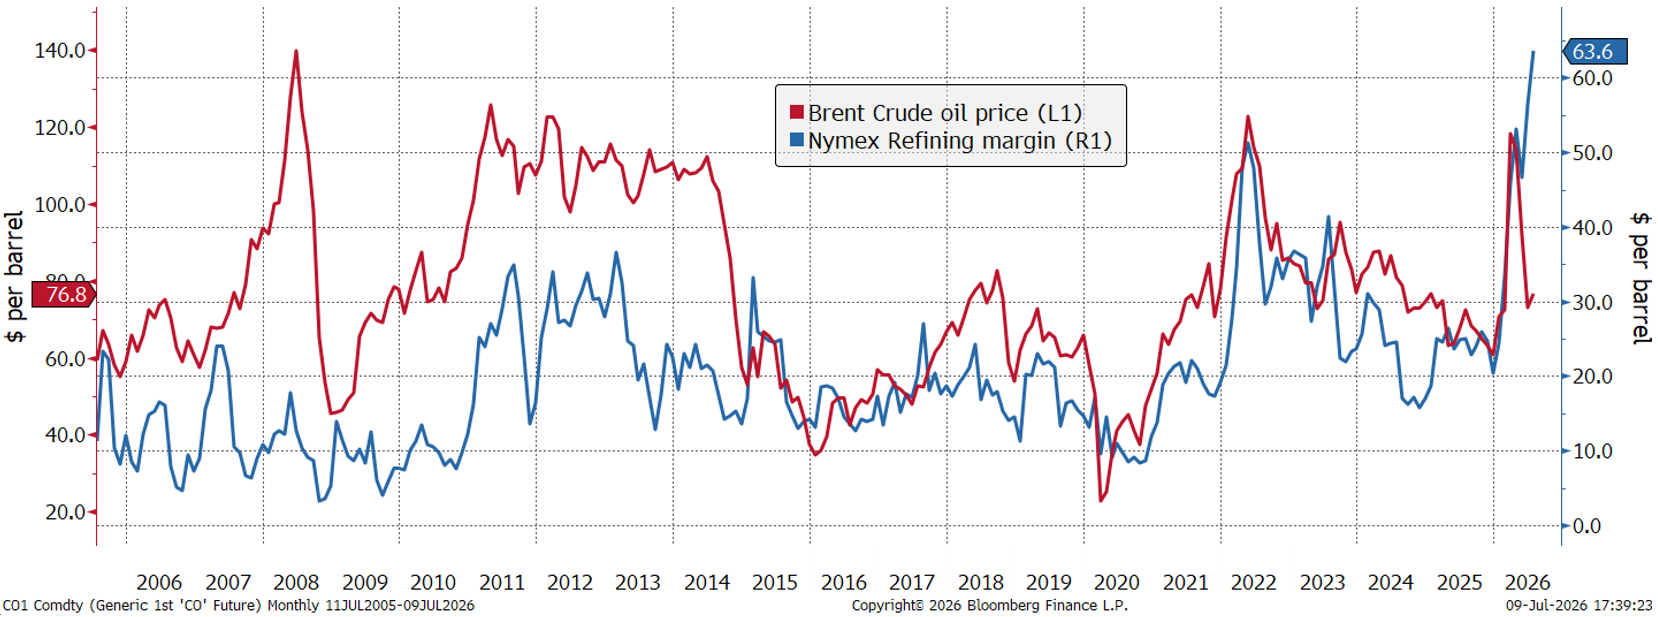
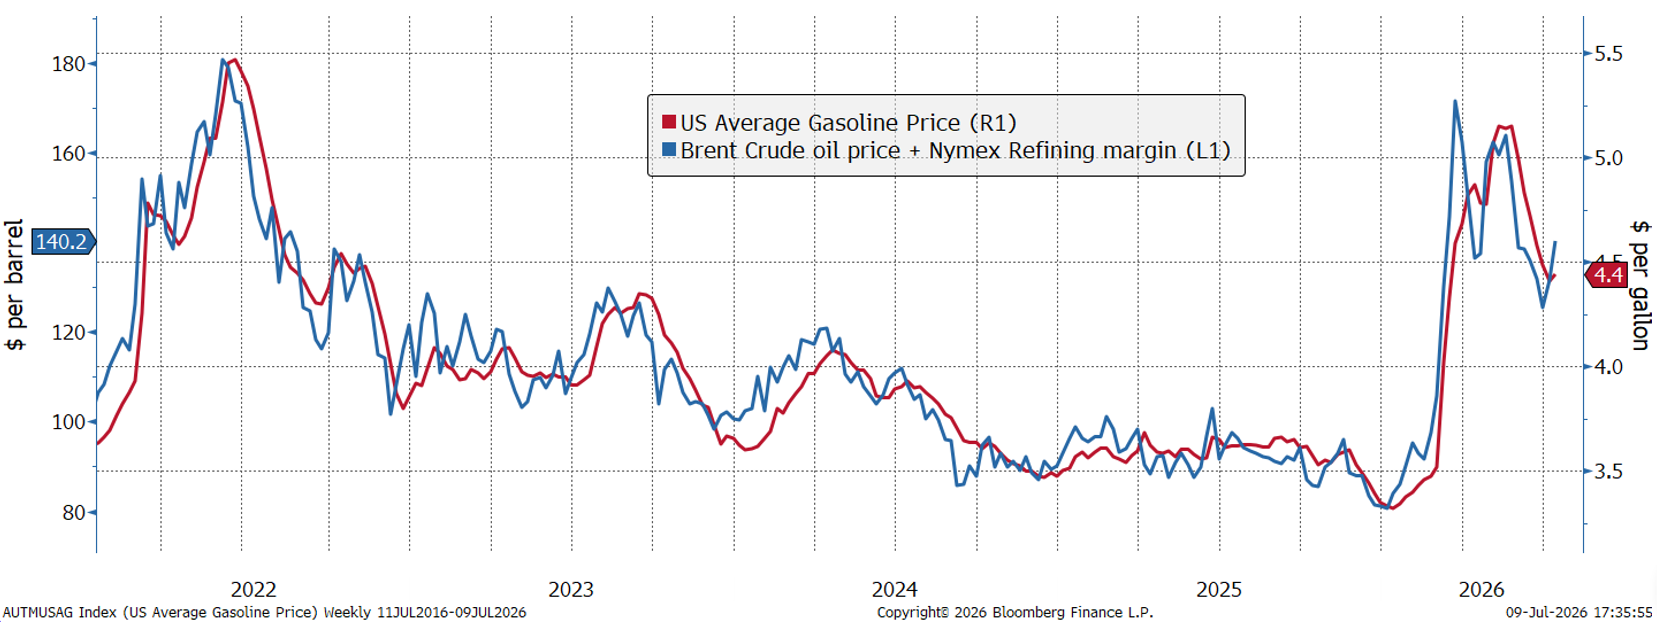
- While the oil price has largely rolled over, refining margins (a la crack spreads) continue to rise due to insufficient refining capacity. While we expect refineries in the gulf to eventually restore this capacity, it will be a gradual, staged process and further aggravated by significant refinery outages in Russia due to the ongoing war with Ukraine. As long as refining margins remain elevated fuel prices will remain well above pre-war levels and continue to pressure inflation higher:
Chart 7: Disconnect in refining margins and oil price limiting lower petrol prices
Source: Bloomberg (9 July 2026)
- Inflation has risen more than expected in the US since the war. While headline inflation understandably has risen 1.8 ppt from 2.4% in February to 4.2% in May given the dramatic rise in energy prices, core inflation has risen 0.4 ppt to 2.9% which will give the Fed plenty of reason to remain hawkish unless this rolls over soon towards their 2% target.
- A flurry of strong nonfarm payroll reports this year and subsequent decline in the unemployment rate from 4.4% in December 2025 to 4.2% in June has also largely removed the case for rate cuts. While corporate profits are currently booming in the US this would typically be supportive of a pickup in hiring.
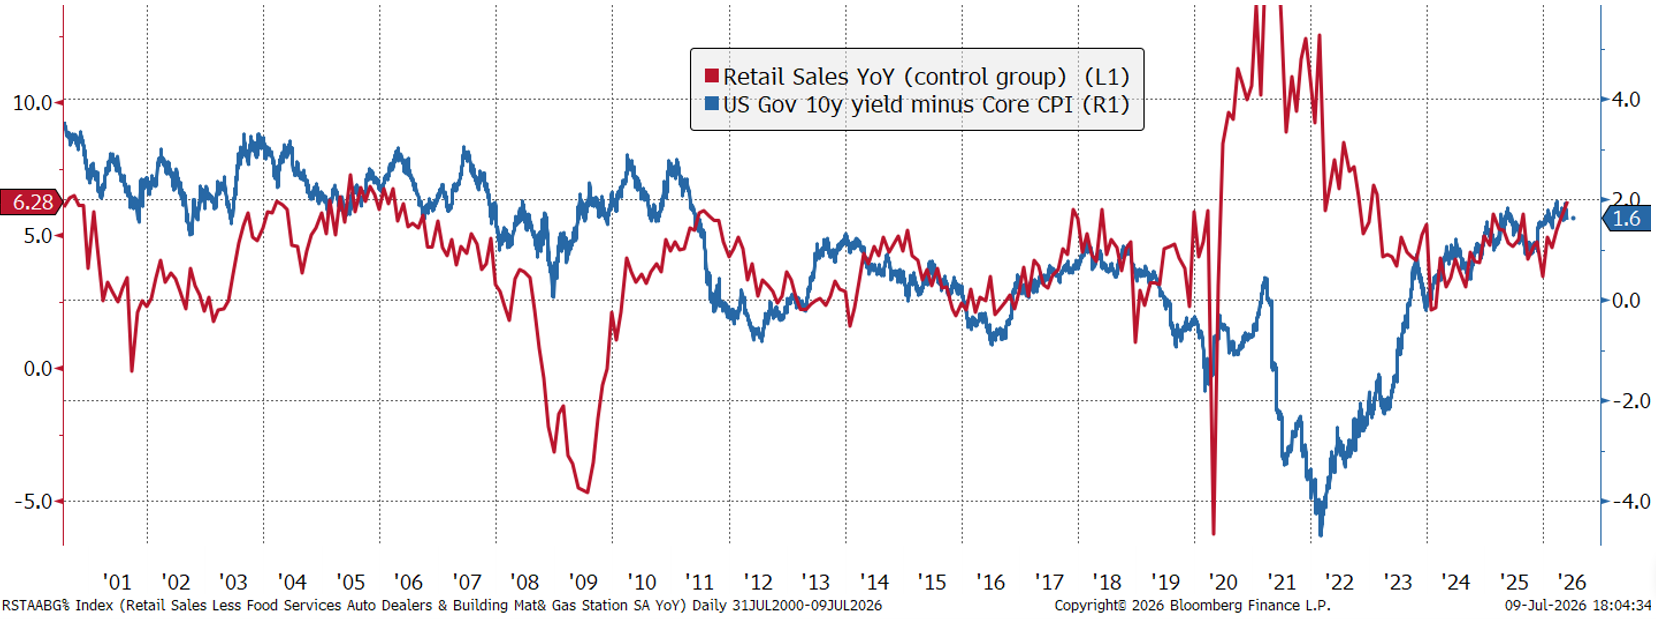
- A powerful reacceleration in retail sales, even when stripping out higher price-driven fuel spending. While encouraging for the global manufacturing cycle which has typically favoured commodity prices and EM currencies like the rand, it has added fuel to the fire for higher real bond yields as the below chart shows. Again, more reason for the Fed to hike interest rates but arguably, at the current consumption growth rate, bond yields may well be at an appropriate level:
Chart 8: Real US 10y Bond yield vs strong retail sales
Source: Bloomberg (9 July 2026)
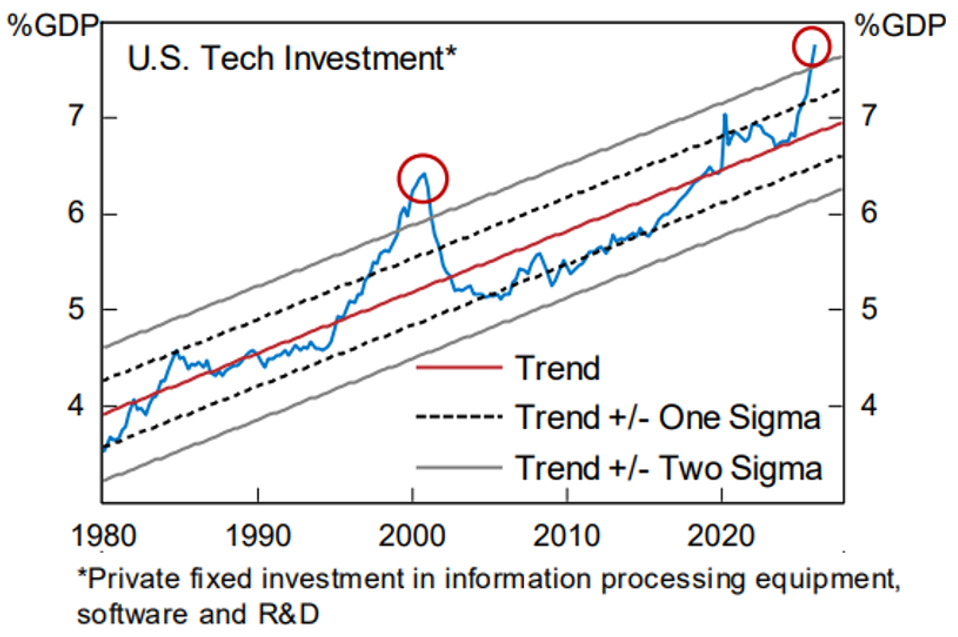
An interesting subplot this quarter was the significant outperformance of AI infrastructure buildout companies. While the traditional US hyper-scalers did rally this quarter, memory chipmakers (Micron, SK Hynix, Samsung), semiconductor fab equipment makers (ASML, Tokyo Electron, Advantest), electrical, cooling & grid hardware for data centres (Vertiv, GE Vernova), and even server OEMs (Dell, HPE) had an even more explosive rally as the AI theme saw a rotation from cheque writers to cheque receivers. As a consequence of this “AI rotation”, indices highly exposed to the AI buildout like South Korea, Japan & Taiwan rallied sharply in the quarter.
We are clearly not in your typical semiconductor boom cycle when you consider the quantum of investment going into AI data centre infrastructure, but every cycle has its peak and we believe the hyper-scalers’ ability to generate a return on this hefty investment will largely determine when this cycle peaks. Since we are still in the early phase of large-scale AI adoption, combined with the fact that cloud providers remain “compute-constrained”, it is difficult to see the cycle ending in the near term.
Chart 9: US tech investment becoming too large to ignore
Source: Alpine Macro (4 June 2026)
Outlook
Amidst the volatility of the Iran war the global commodity cycle has remained resilient which so far speaks of limited demand destruction from the closure of the Strait of Hormuz. While the risk remains of another prolonged closure of the Strait due to a breakdown of the MOU, which would pressure fuel prices higher again, we are encouraged by how well the cycle is holding up based on the latest strong retail sales growth as well as the latest uptick in Advanced Economy’s industrial production, as seen below. Dr Copper, a reliable barometer of the health of the global economy, has continued to power ahead as well despite the oil crisis fears:
Chart 10: Global industrial cycle persists
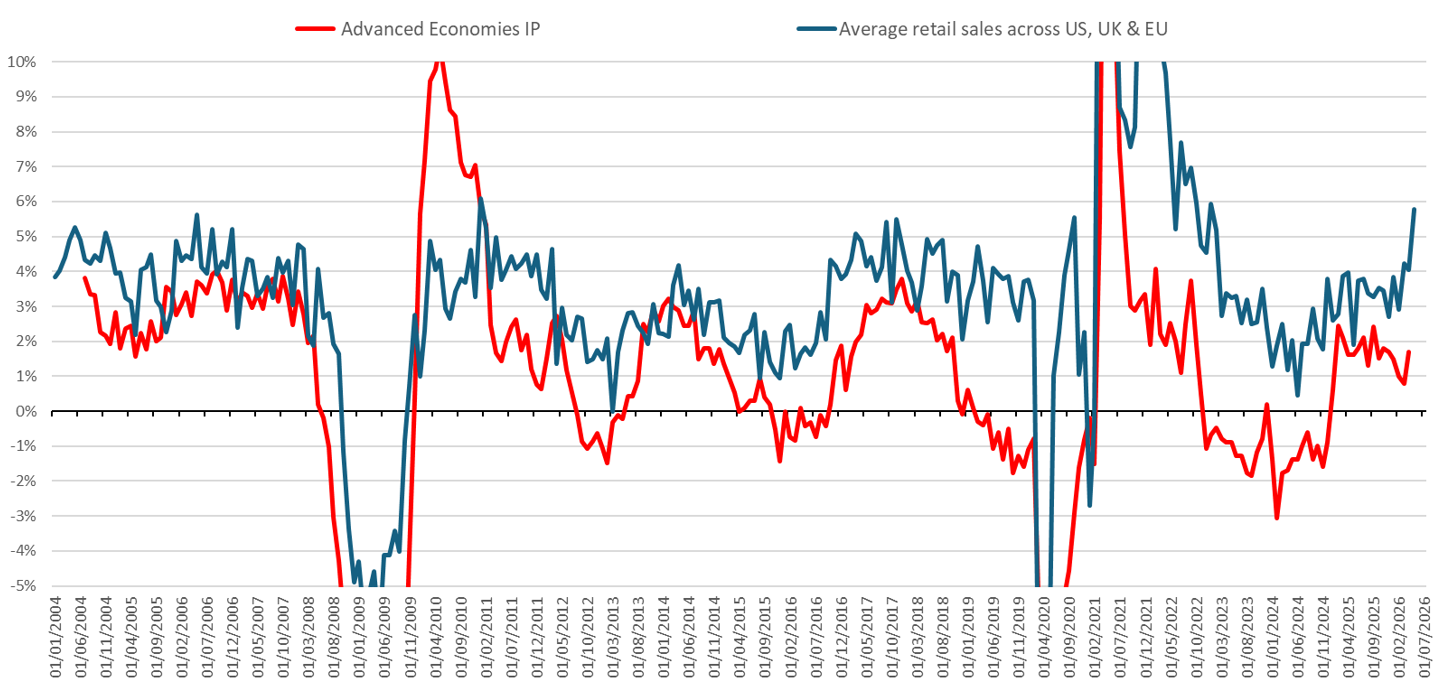
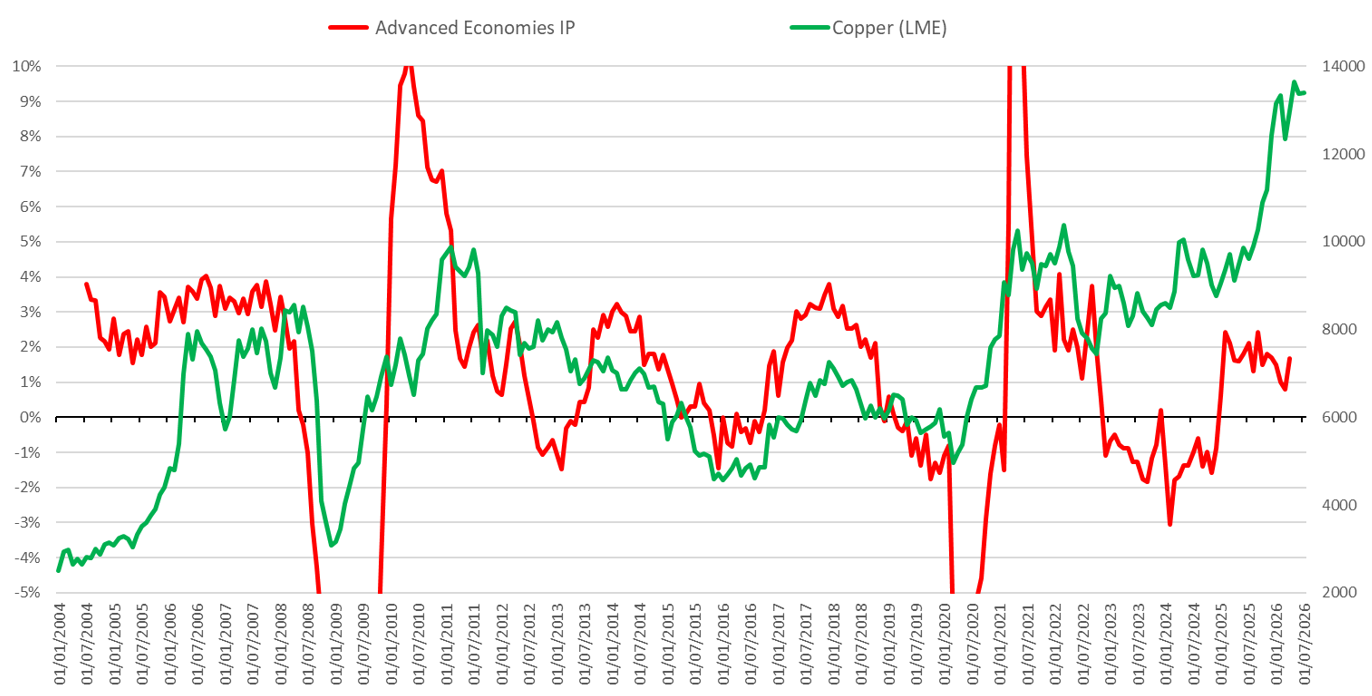
Source: Bloomberg (30 June 2026)
While the cycle appears to look intact, we continue to be as cautious as we were in Q1 when we largely de-risked the portfolio with profit-taking of our previous year’s RESI winners. This quarter we further reduced precious metal mining exposure but also took profits on Anglo American and Glencore who benefitted from the strong rally in the copper price and are now hovering close to peak cycle profit margins.
While we have increased our offshore exposure across the funds, we are still well exposed to South African interest rate sensitives via banks and select insurers and retailers. As shown below, a gap has emerged between the relative performance of our banks vs MSCI World and our long term government bond yield spread to the US. In addition, our banks screen attractive vs the more expensive MSCI World and as long as the global cycle remains intact we deem this a favourable relative trade.
Chart 11: Interest rate sensitives still boosted by relative bond yields
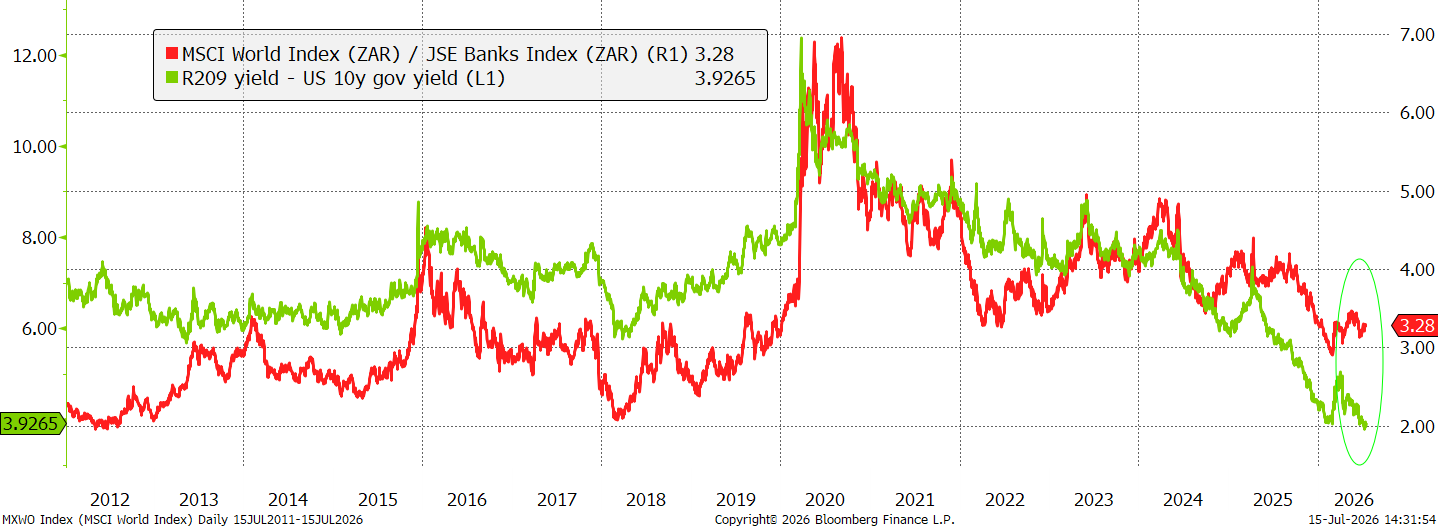
Source: Bloomberg (30 June 2026)
While our 10-year spread over the US does appear to be tight versus history we believe the relative inflation rate, and therefore the relative monetary policy rate, will be sustainably lower. Critically SA and EM spreads tend to remain compressed while global growth is supportive, its therefore essential that above trend global growth continues going forward.
Chart 12: Lower inflation differentials should anchor the SA 10y yield
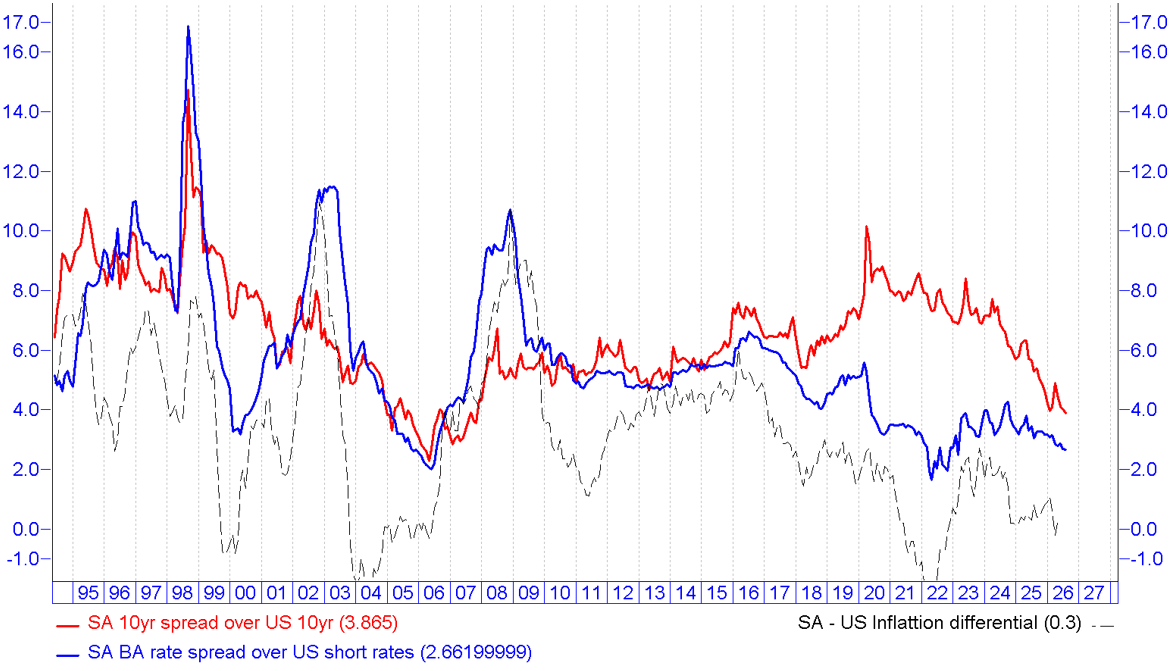
Source: IRESS (30 June 2026)
A significant risk, as explained earlier, is further dollar strength as a result of the stronger macro picture out of the US. While this is not our base case, we have reduced our rand exposure accordingly given this increased risk.
Asset Class Returns
Key Market Takeaways for the Quarter ended
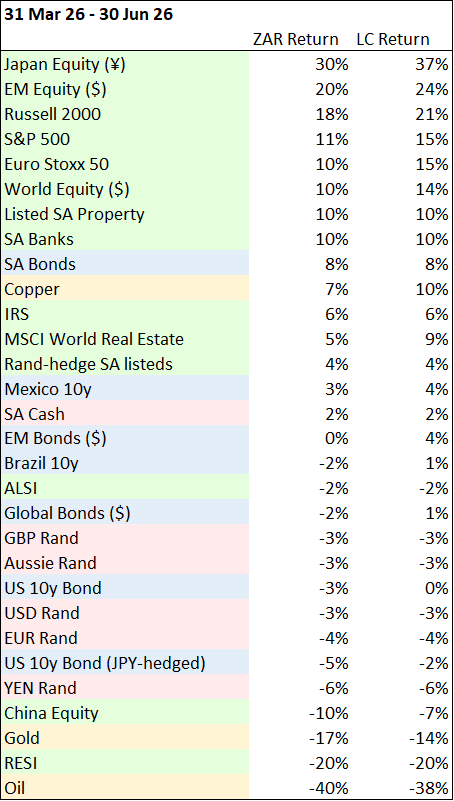
- The Rand strengthened broadly against every major currency, in sharp contrast to the prior quarter. USD/ZAR was down 3%, EUR/ZAR down 4%, GBP/ZAR down 3%, AUD/ZAR down 3%, and JPY/ZAR down 6%. This meant unhedged global asset returns were meaningfully compressed in ZAR terms relative to their local-currency return.
- Developed and emerging market equities rallied hard, with Rand strength taking the edge off for local investors. In Local Currency (LC) terms the S&P 500 returned +15%, Euro Stoxx 50 +15%, World Equity +14%, Russell 2000 +21%, and EM Equity +24%. Japan was the standout, up 37% in yen and still 30% in ZAR after the currency drag. In ZAR terms all held up well despite the stronger Rand. China Equity was the one laggard, down 10% in ZAR (–7% LC).
- Bond markets were mixed and currency driven. SA Bonds returned a solid +8%. By contrast, Global Bonds (–2% ZAR) and US 10-year Treasuries (–3% ZAR) were negative once translated back to Rand, despite being flat to modestly positive in LC (+1% and 0%). The JPY-hedged US 10-year was down 5% ZAR.
- Domestic equities were roughly flat overall but masked a sharp internal rotation. The ALSI returned –2%. Listed SA Property (+10%) and SA Banks (+10%) led, with the Interest Rate Sensitive (IRS) basket also positive at +6% and Rand-hedge SA listed stocks up 4%. This is a reversal from the prior quarter, when rate-sensitive and property counters were the weakest segments of the market.
- Commodities were the story of the quarter, and not in a good way for resource exposure. RESI fell sharply, down 20%, dragged by a 17% decline in gold and a 40% collapse in the oil price. Copper was the exception, up 7% in ZAR (+10% LC). The scale of the oil and gold reversal points to a sharp unwind of the geopolitical risk premium that had been built into commodity prices.
Additional Key Observations
- The quarter was defined by a violent unwind of Q1’s commodity and safe-haven trade. Oil’s 40% ZAR decline and gold’s 17% decline both suggest a de-escalation of the Middle East risk premium that drove the prior quarter’s surge, consistent with the improved conditions in the Strait of Hormuz through Q2. This directly explains RESI’s underperformance (–20%), a sharp reversal from being the standout sector last quarter.
- Rand strength was the single biggest swing factor for global exposure this quarter. Every major DM equity market delivered double-digit LC returns, but the 3–6% appreciation of the Rand against USD, EUR, GBP and JPY meant ZAR-based investors captured meaningfully less of that upside.
In summary, the quarter marked a sharp reversal of Q1’s dynamics. Commodity and safe-haven exposure became the biggest drag this quarter, with gold and oil unwinding violently. In their place, global risk assets rallied strongly in local currency terms, but a broadly stronger Rand capped the translated benefit for ZAR-based investors and turned modest gains in US Treasuries and global bonds into outright ZAR losses. Domestically, the JSE was roughly flat at the index level, masking a rotation firmly in favour of property and banks over resources.
Chart 13: Global Asset Q2 returns
LC Return = the security’s return expressed in its local currency.
ZAR Return = the security’s return expressed in South African Rand (ZAR).
Source: Bloomberg (30th June 2026)
Portfolio Changes
From an asset allocation perspective, we still prefer equities to bonds, and emerging markets over developed markets. Within equities, we favour South Africa and emerging markets, but also retain some select DM exposure in Japan, US Tech, and Energy.
Our bond exposure is largely in emerging markets that are better priced than South Africa, such as Brazil and Mexico, although we are not negative on South African Bonds in isolation. We also hold slightly more cash than usual in the appropriate funds.
Looking at the sector changes
- The sectors with the largest reductions in exposure were Resources, Energy, Commodities and Insurance
- The sectors with the largest additions in exposure were Banks, Technology and Retail
|
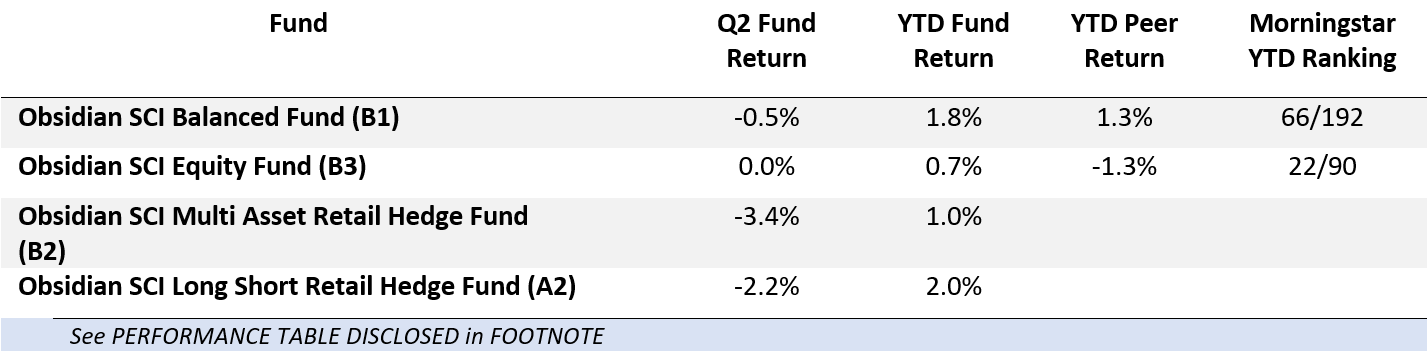
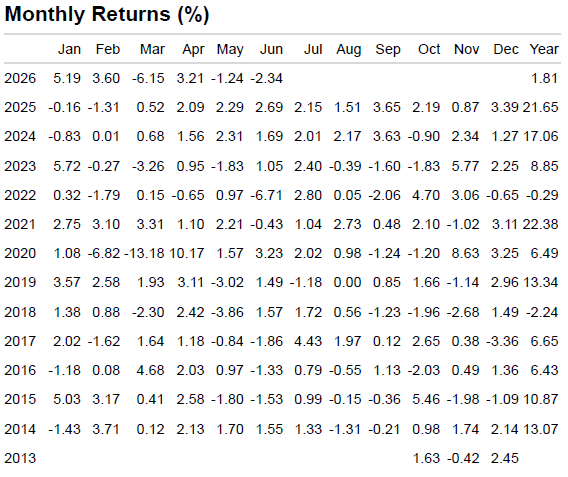
Obsidian SCI Balanced Fund (B1):
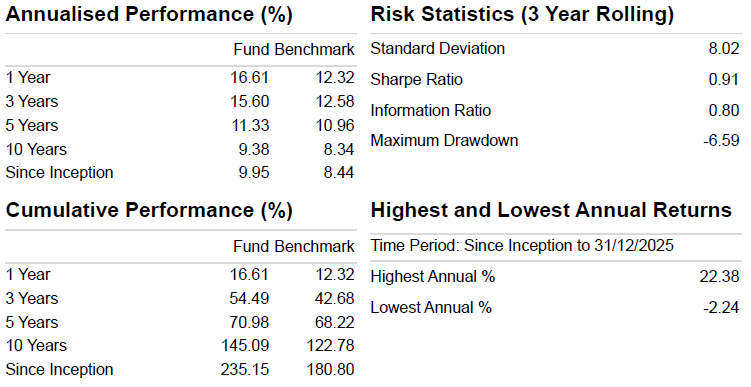
Obsidian SCI Equity Fund (B3)
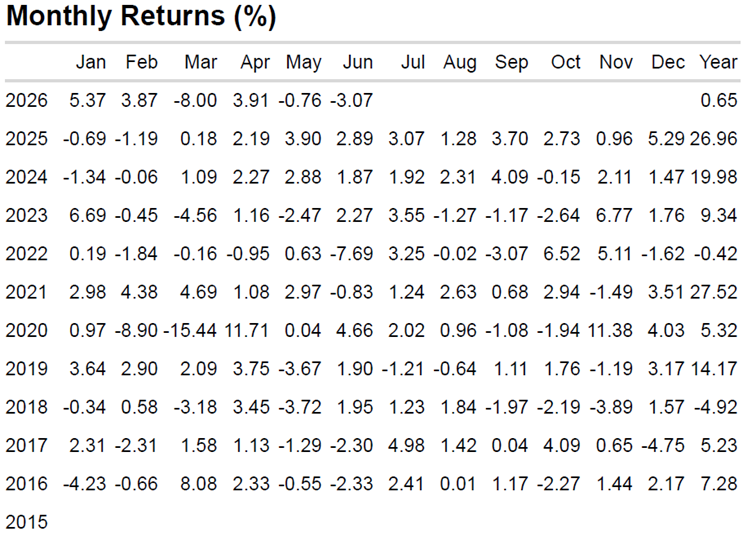
Obsidian SCI Long Short Retail Hedge Fund (A2)
Obsidian SCI Multi Asset Retail Hedge Fund (B2)
Disclaimer: Obsidian Capital (Pty) Ltd (FSP number 32444) is an authorised Financial Services Provider in terms of the FAIS Act.
The information contained in this article does not constitute financial advice as contemplated in terms of the Financial Advisory and Intermediary Services Act, and should be read in conjunction with a minimum disclosure document (MDD) and the Upfront Disclosure Document. Use of or reliance on this information is at own risk. Independent professional financial advice should be sought before making an investment decision.
Sanlam Collective Investments (RF) (Pty) Ltd, a registered and approved Manager in Collective Investment Schemes in Securities. Collective investment schemes are generally medium- to long-term investments. Past performance is not necessarily a guide to future performance, and that the value of investments / units / unit trusts may go down as well as up. A schedule of fees and charges and maximum commissions is available from the Manager on request. Collective investments are traded at ruling prices and can engage in borrowing and scrip lending. The Manager does not provide any guarantee either with respect to the capital or the return of a portfolio. Performance is based on NAV to NAV calculations with income reinvestments done on the ex-div date. Performance is calculated for the portfolio and the individual investor performance may differ as a result of initial fees, actual investment date, date of reinvestment and dividend withholding tax. The manager has the right to close the portfolio to new investors in order to manager it more efficiently in accordance with its mandate.
While CIS in hedge funds differ from CIS in securities (long-only portfolios) the two may appear similar, as both are structured in the same way and are subject to the same regulatory requirements. The ability of a portfolio to repurchase is dependent upon the liquidity of the securities and cash of the portfolio. A manager may, in exceptional circumstances, suspend repurchases for a period, subject to regulatory approval, to await liquidity and the manager must keep the investors informed about these circumstances. Further risks associated with hedge funds include: investment strategies may be inherently risky; leverage usually means higher volatility; short-selling can lead to significant losses; unlisted instruments might be valued incorrectly; fixed income instruments may be low-grade; exchange rates could turn against the fund; other complex investments might be misunderstood; the client may be caught in a liquidity squeeze; the prime broker or custodian may default; regulations could change; past performance might be theoretical; or the manager may be conflicted.
A copy of the Performance fee Frequently Asked Questions can be obtained from our website: www.sanlaminvestments.com. Annualised return is the weighted average compound growth rate over the period measured.